How to make charts by using Google Charts API
Aim
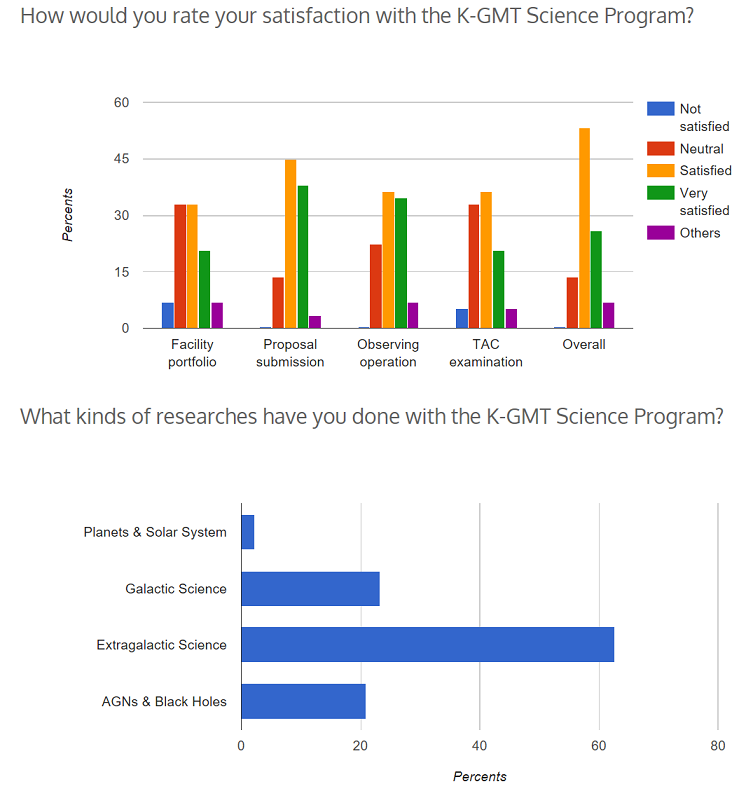
This page describes how to make the charts (e.g., bar, pie) by using Google Charts API.

Preparation
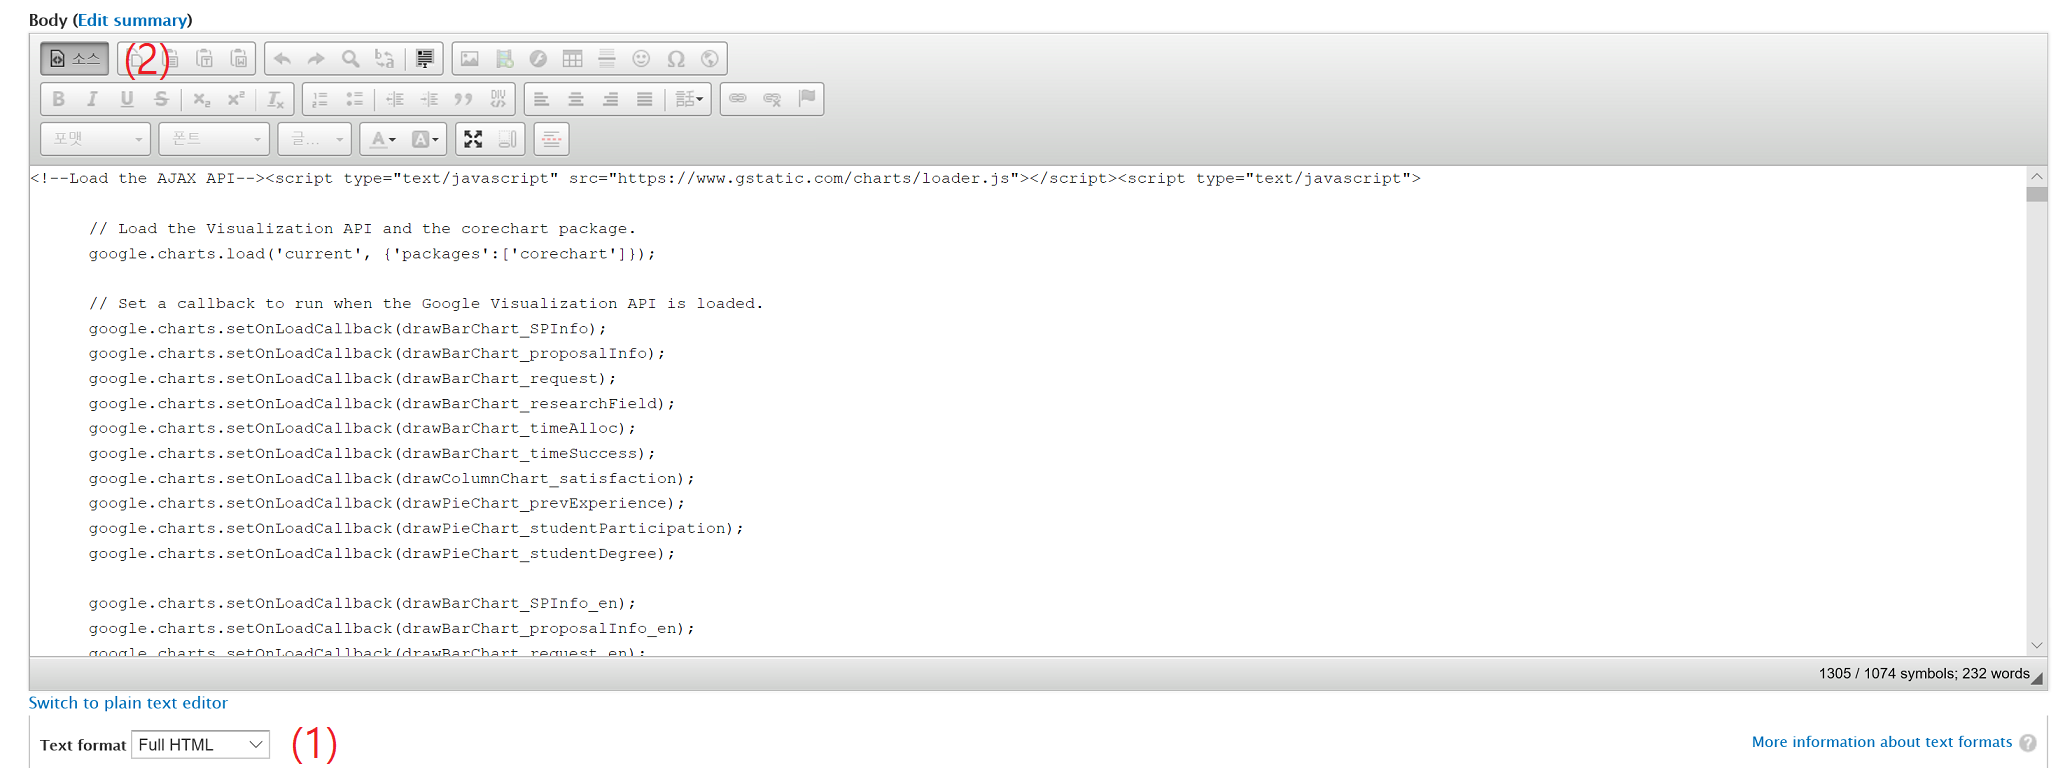
Create a new page. Check "Full HTML". Check "Source" for writing the source directly.
(See (1) and (2) below)

Basic Code Structure
For further details, see https://developers.google.com/chart/interactive/docs/
| <!--Load the AJAX API--> <script type="text/javascript" src="https://www.gstatic.com/charts/loader.js"></script> <script type="text/javascript"> google.charts.load('current', {'packages':['corechart']}); // Set callbacks to run when the Google Visualization API is loaded. // Callback that creates and populates a data table, // Set chart options // Instantiate and draw our chart, passing in some options. // Add as many functions as you need. </script> <!--Div that will hold the charts--> <!-- Add as many charts as you want --> |
