How to make charts by using Google Charts API


Aim

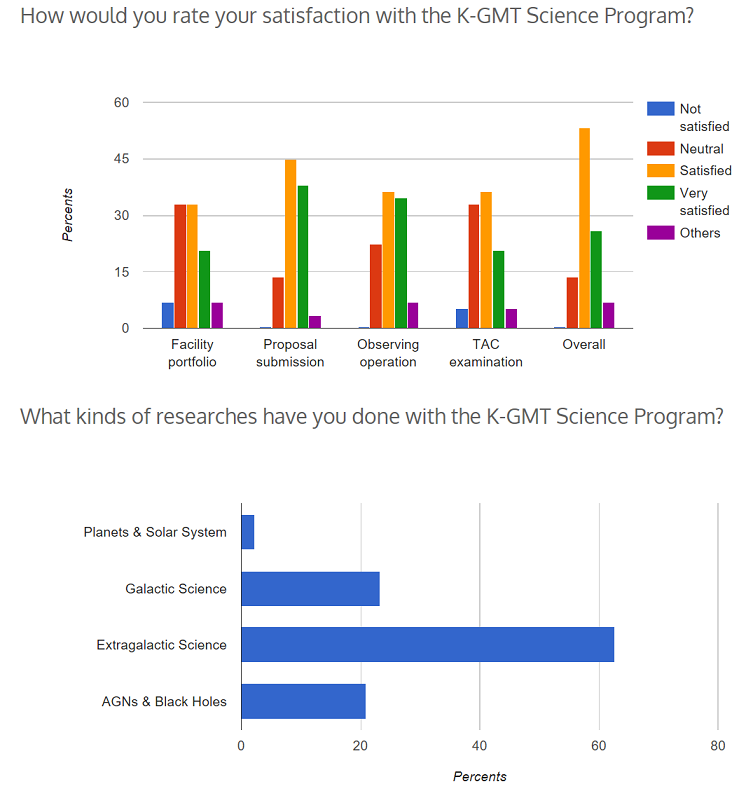
This page describes how to make the charts (e.g., bar, pie) by using Google Charts API.
Preparation

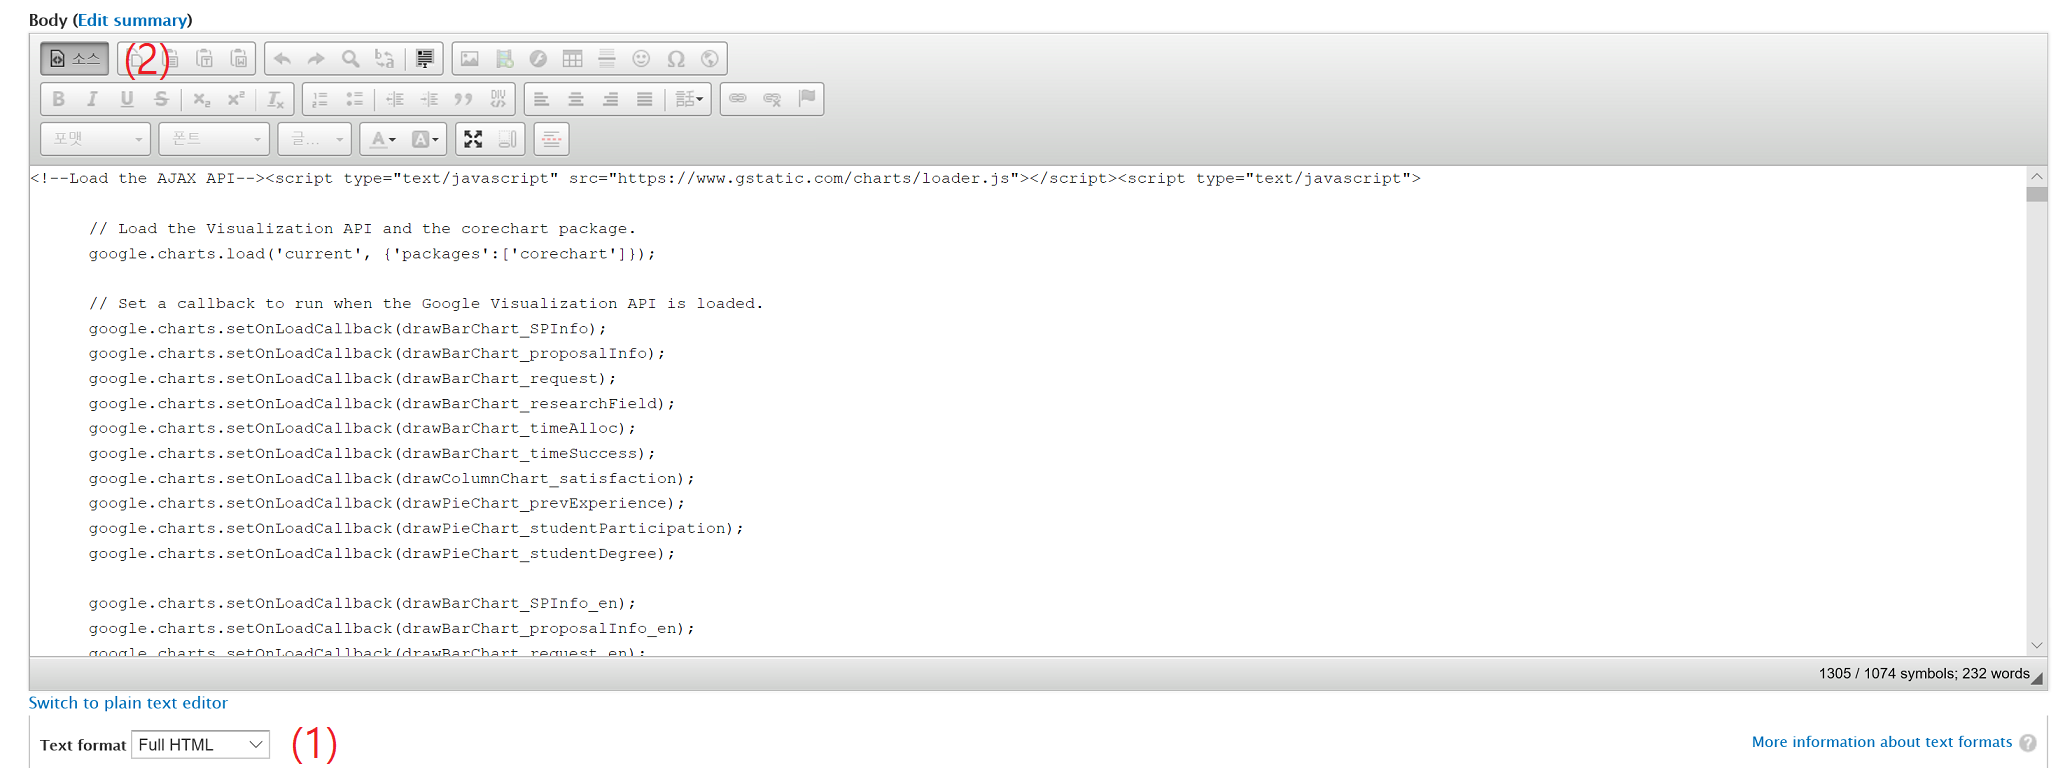
Create a new page. Check "Full HTML". Check "Source" for writing the source directly.

(See (1) and (2) below)
Basic Code Structure

For further details, see https://developers.google.com/chart/interactive/docs/

<!--Load the AJAX API-->
<script type="text/javascript" src="https://www.gstatic.com/charts/loader.js"></script>
<script type="text/javascript">

      google.charts.load('current', {'packages':['corechart']});

      // Set callbacks to run when the Google Visualization API is loaded.
      google.charts.setOnLoadCallback(drawChart1);
      google.charts.setOnLoadCallback(drawChart2);
      // ...Add as many callbacks as you want to draw

      // Callback that creates and populates a data table,
      // instantiates the pie chart, passes in the data and
      // draws it.
      function drawChart1() {   // name of the function should be the same to the previous declaration (see blue color).
        // Create the data table.
        var data = new google.visualization.DataTable();
        data.addColumn('string', 'Type');   // type and name of the first item : usually the type
        data.addColumn('number', 'Percent');   // type and name of the second item. type more if you have more items.
        data.addRows([

          ['Type1', 10],
          ['Type2', 20],
        ]);   // Change the values as you want.

        // Set chart options
        var options = {'width':700,
                       'height':350};

        // Instantiate and draw our chart, passing in some options.
        // Here I made "bar" chart(BarChart), but you can try pie chart(PieChart), column chart(ColumnChart), etc.
        // "chart_div_1" (red color) should be the same to the id of the DIV that the chart would be actually placed.
        var chart = new google.visualization.BarChart(document.getElementById('chart_div_1'));
        chart.draw(data, options);
      }

      // Add as many functions as you need.
      function drawChart2() {
        // ... structure of the function would be the same to the previous one.
      }

</script>

<!--Div that will hold the charts-->
<h3>Title of the chart 1</h3>
<div id="chart_div_1">&nbsp;</div>

<!-- Add as many charts as you want -->
<!-- Please remember that you need to use the exact id that you declared in the functions -->